Soybean meal (SBM) is a source of P in diets for swine. However, the P in SBM is stored as part of phytate, and pigs have very limited production of endogenous phytase. Therefore, to improve P availability, commercial pig diets often include supplemental phytase. This practice increases P digestibility, decreases the need for added phosphate, reduces feed costs, and decreases phosphorus excretion in manure. The release of P from phytate in SBM is believed to be in a dose-response manor. In addition, the destruction of phytate that is caused by phytase will also result in release of inositol, which is a sugar that may improve growth performance of pigs. However, there is very limited knowledge about how different levels of phytase influence plasma concentrations of inositol in growing pigs. Therefore, the objective of this work was to test the hypothesis that inclusion of microbial phytase in diets for growing pigs containing SBM will improve the digestibility of P in a dose-response manner and that inclusion of microbial phytase in diets for growing pigs also will increase plasma inositol levels of pigs.
Materials and methods
Four sources of SBM were procured from ADM (Decatur, IL), University of Illinois Feed Mill (Urbana, IL), Stutzman’s Feed & Supply (Arthur, IL), and United Animal Health (Sheridan, IN), and were labelled source 01, 02, 03, and 04, respectively. Twenty diets were arranged in a 4 × 5 factorial with the four sources of SBM and levels of supplemental phytase (i.e., 0, 500, 1,000, 2,000, and 4,000 FTU/kg diet). In all diets, SBM was the only source of phytate and P. All diets contained all nutrients except P and Ca at or above the requirements for pigs.
A total of 160 pigs were allotted to one of the 20 diets using a randomized complete block design with four blocks of 40 pigs with two pigs per diet in each block for a total of eight replicate pigs per diet. Pigs were placed in individual metabolism crates that were equipped with a self-feeder, a nipple waterer, a fully slatted floor, and a screen floor to allow for the total collection of fecal materials.
Daily feed allotments were divided into two equal meals that were provided at 0800 and 1600 h and pigs were provided feed at three times the daily maintenance requirement for metabolizable energy (i.e., 197 kcal metabolizable energy per kg body weight0.60; NRC, 2012).
Experimental diets were fed for 18 d, with the initial 10 d considered the adaptation period. Feces were collected for 4 d following the adaptation period using the marker-to-marker procedure (Adeola, 2001). Fecal samples were stored at -20 °C immediately after collection. Urine was collected in buckets containing a preservative of 50 mL of 6N HCl that were placed under each metabolism crate.
On d 1 and 18, blood samples were collected from the jugular vein of all pigs and plasma was collected and stored at -80 ºC until analysis. Diet, fecal, and urine samples were analyzed for P and the standardized total tract digestibility of P was calculated for each diet. Blood samples were analyzed for plasma inositol.
Results
There were no interactions between phytase and source of SBM for weight of feces, P in feces, ATTD of P, STTD of P, or P retention (Table 5). Feed intake of pigs fed the diet containing source 03 with 4,000 FTU/kg was greater (P < 0.05) compared with pigs fed diets containing source 01 without phytase. Phosphorus in urine (ppm) was less (P < 0.05) from pigs fed the diet containing source 01 and 04 without phytase compared with the other diets containing phytase. However, when calculated as g excretion of P per day, no interactions were observed.
The source of SBM did not influence any response variables and no differences among the 4 sources of SBM were observed. However, as the concentration of phytase increased in the diets, excretion of P in feces both in % and in g/d was reduced (P < 0.001) and P excretion in urine (g/d) was also reduced (P < 0.001) as phytase increased in diets. Phytase also increased (P < 0.001) daily absorption of P as well as ATTD and STTD of P and retention of P calculated as % of intake as well as in g/d was also increased (P < 0.001) as phytase was included in the diet.
There were no interactions between phytase and source of SBM for concentration of plasma inositol on d 18, and source of SBM did not influence plasma inositol (Table 6). However, the concentration of inositol in plasma increased (P < 0.001) as inclusion of phytase increased in the diets.
Conclusions
Results demonstrated that the STTD of P in SBM is not influenced by the source of SBM used and that increased additions of microbial phytase to the diets increased digestibility and retention of P by growing pigs. This is likely a result of release of P from phytate in SBM as phytase was included in the diet. The source of SBM did not influence plasma inositol, but plasma inositol increased as dietary phytase increased indicating absorption of inositol from the small intestine as phytate was destroyed by phytase.
Key points:
- Increasing levels of microbial phytase in SBM-based diets increased the ATTD and STTD, and retention of P in growing pigs, regardless of SBM source.
- Different sources of SBM had no significant effect on P digestibility or inositol concentration in plasma, indicating consistency across SBM suppliers.
- As dietary phytase inclusion increased, plasma inositol levels also increase, this indicates that phytate degradation by phytase leads to inositol release and absorption—an added metabolic benefit beyond phosphorus release.
Table 1. Phosphorus balance in growing pigs fed experimental diets1,2
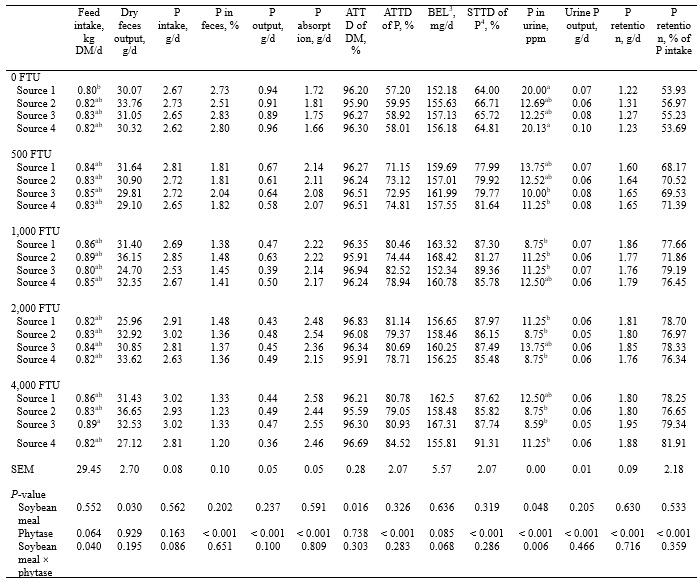
1Each least squares mean is the mean of 7-8 observations.
2Phytase: Quantum Blue 5000 (AB Vista, Marlborough, UK).
3BEL = Basal endogenous losses, this value was estimated to be 190 mg per kg of DM intake (NRC, 2012). The daily basal EPL (mg/d) for each diet was calculated by multiplying the EPL (mg per kg of the DM intake) by the daily DM intake of each diet.
4Values for STTD were calculated by correcting values for ATTD for basal endogenous losses (NRC, 2012).
Table 2. Plasma inositol in growing pigs fed experimental diets1,2
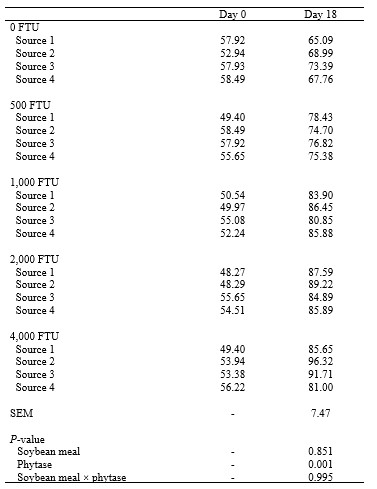
1Each least squares mean is the mean of 6-8 observations.
2Phytase: Quantum Blue 5000 (ABvista, Marlborough, UK).